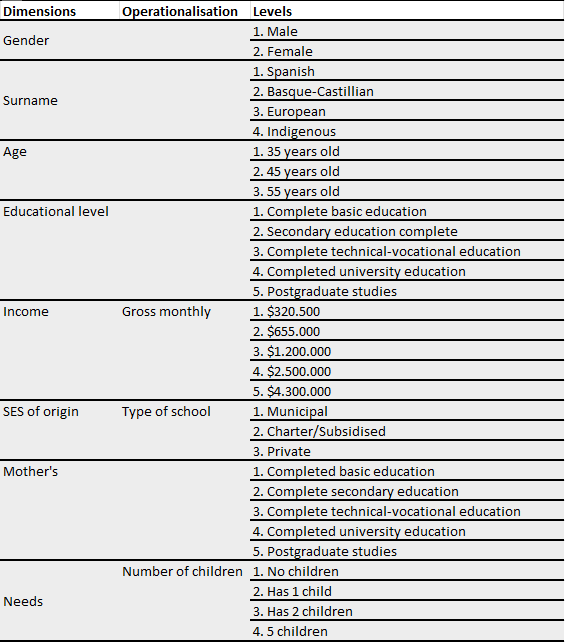
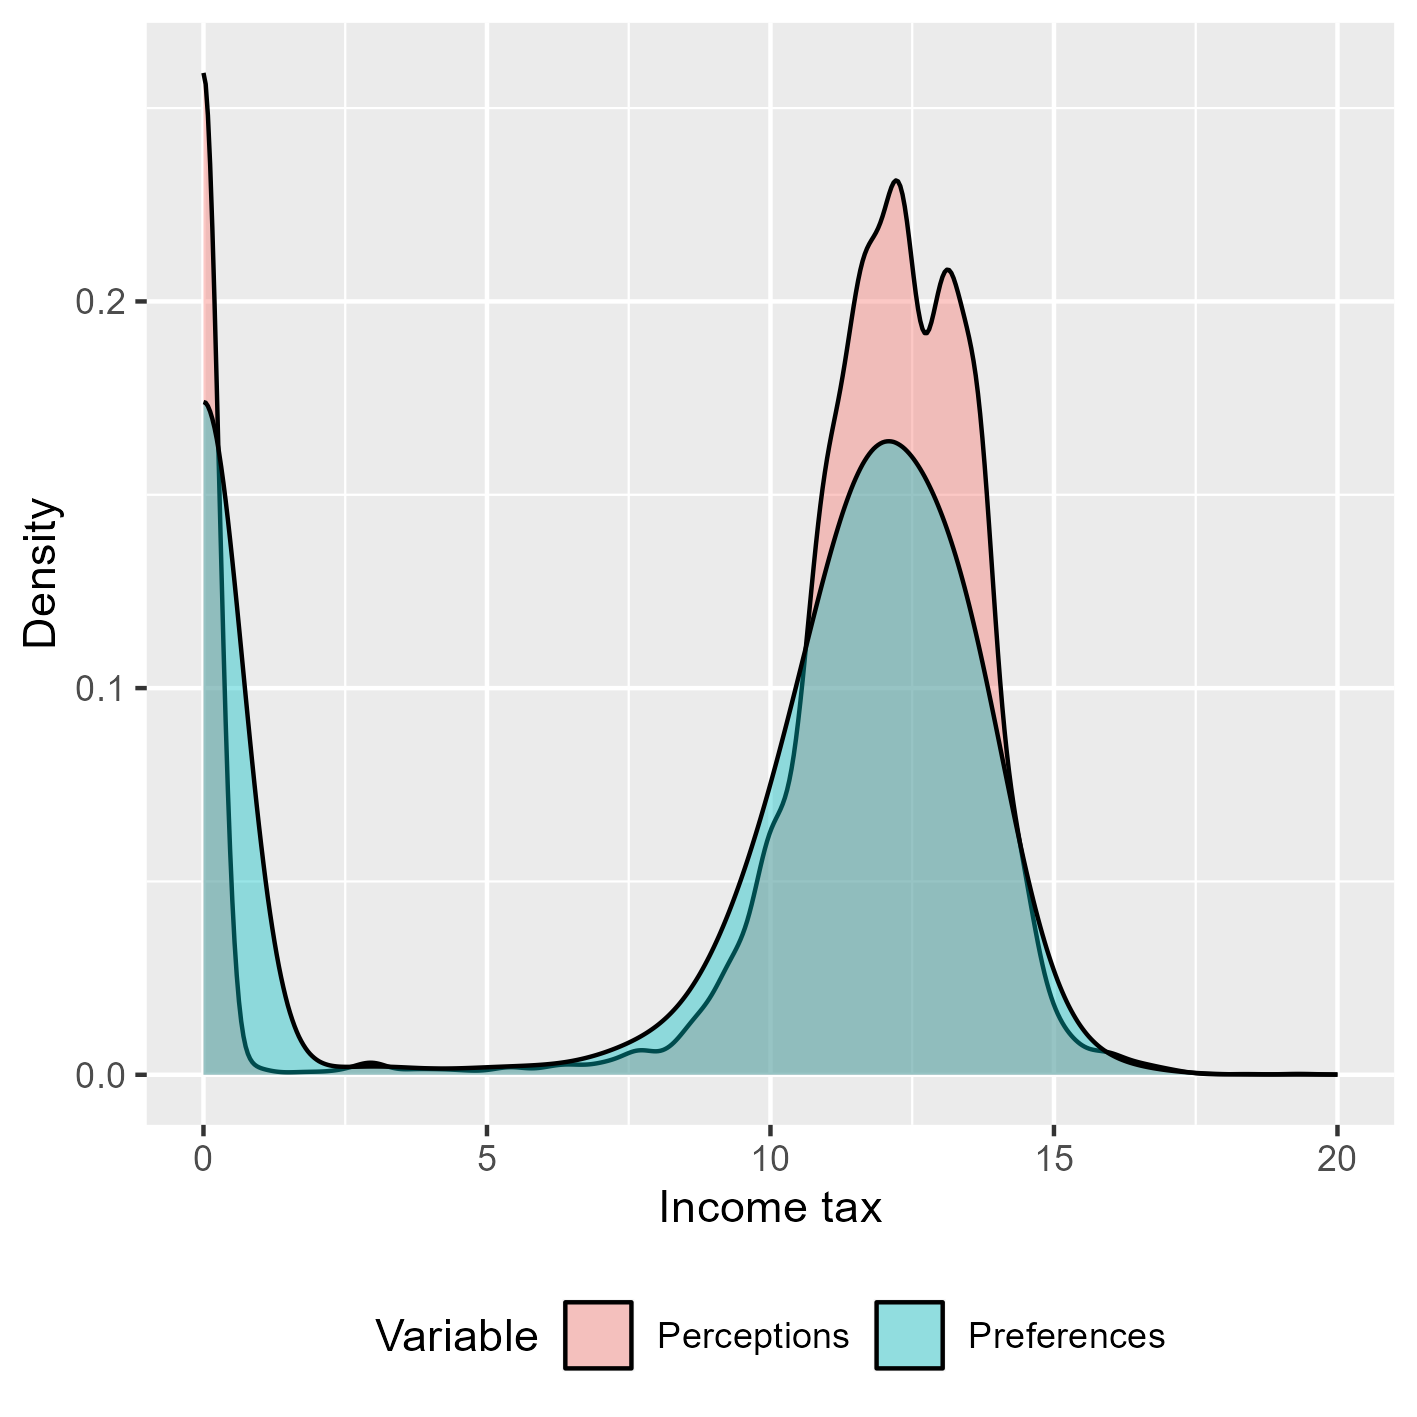
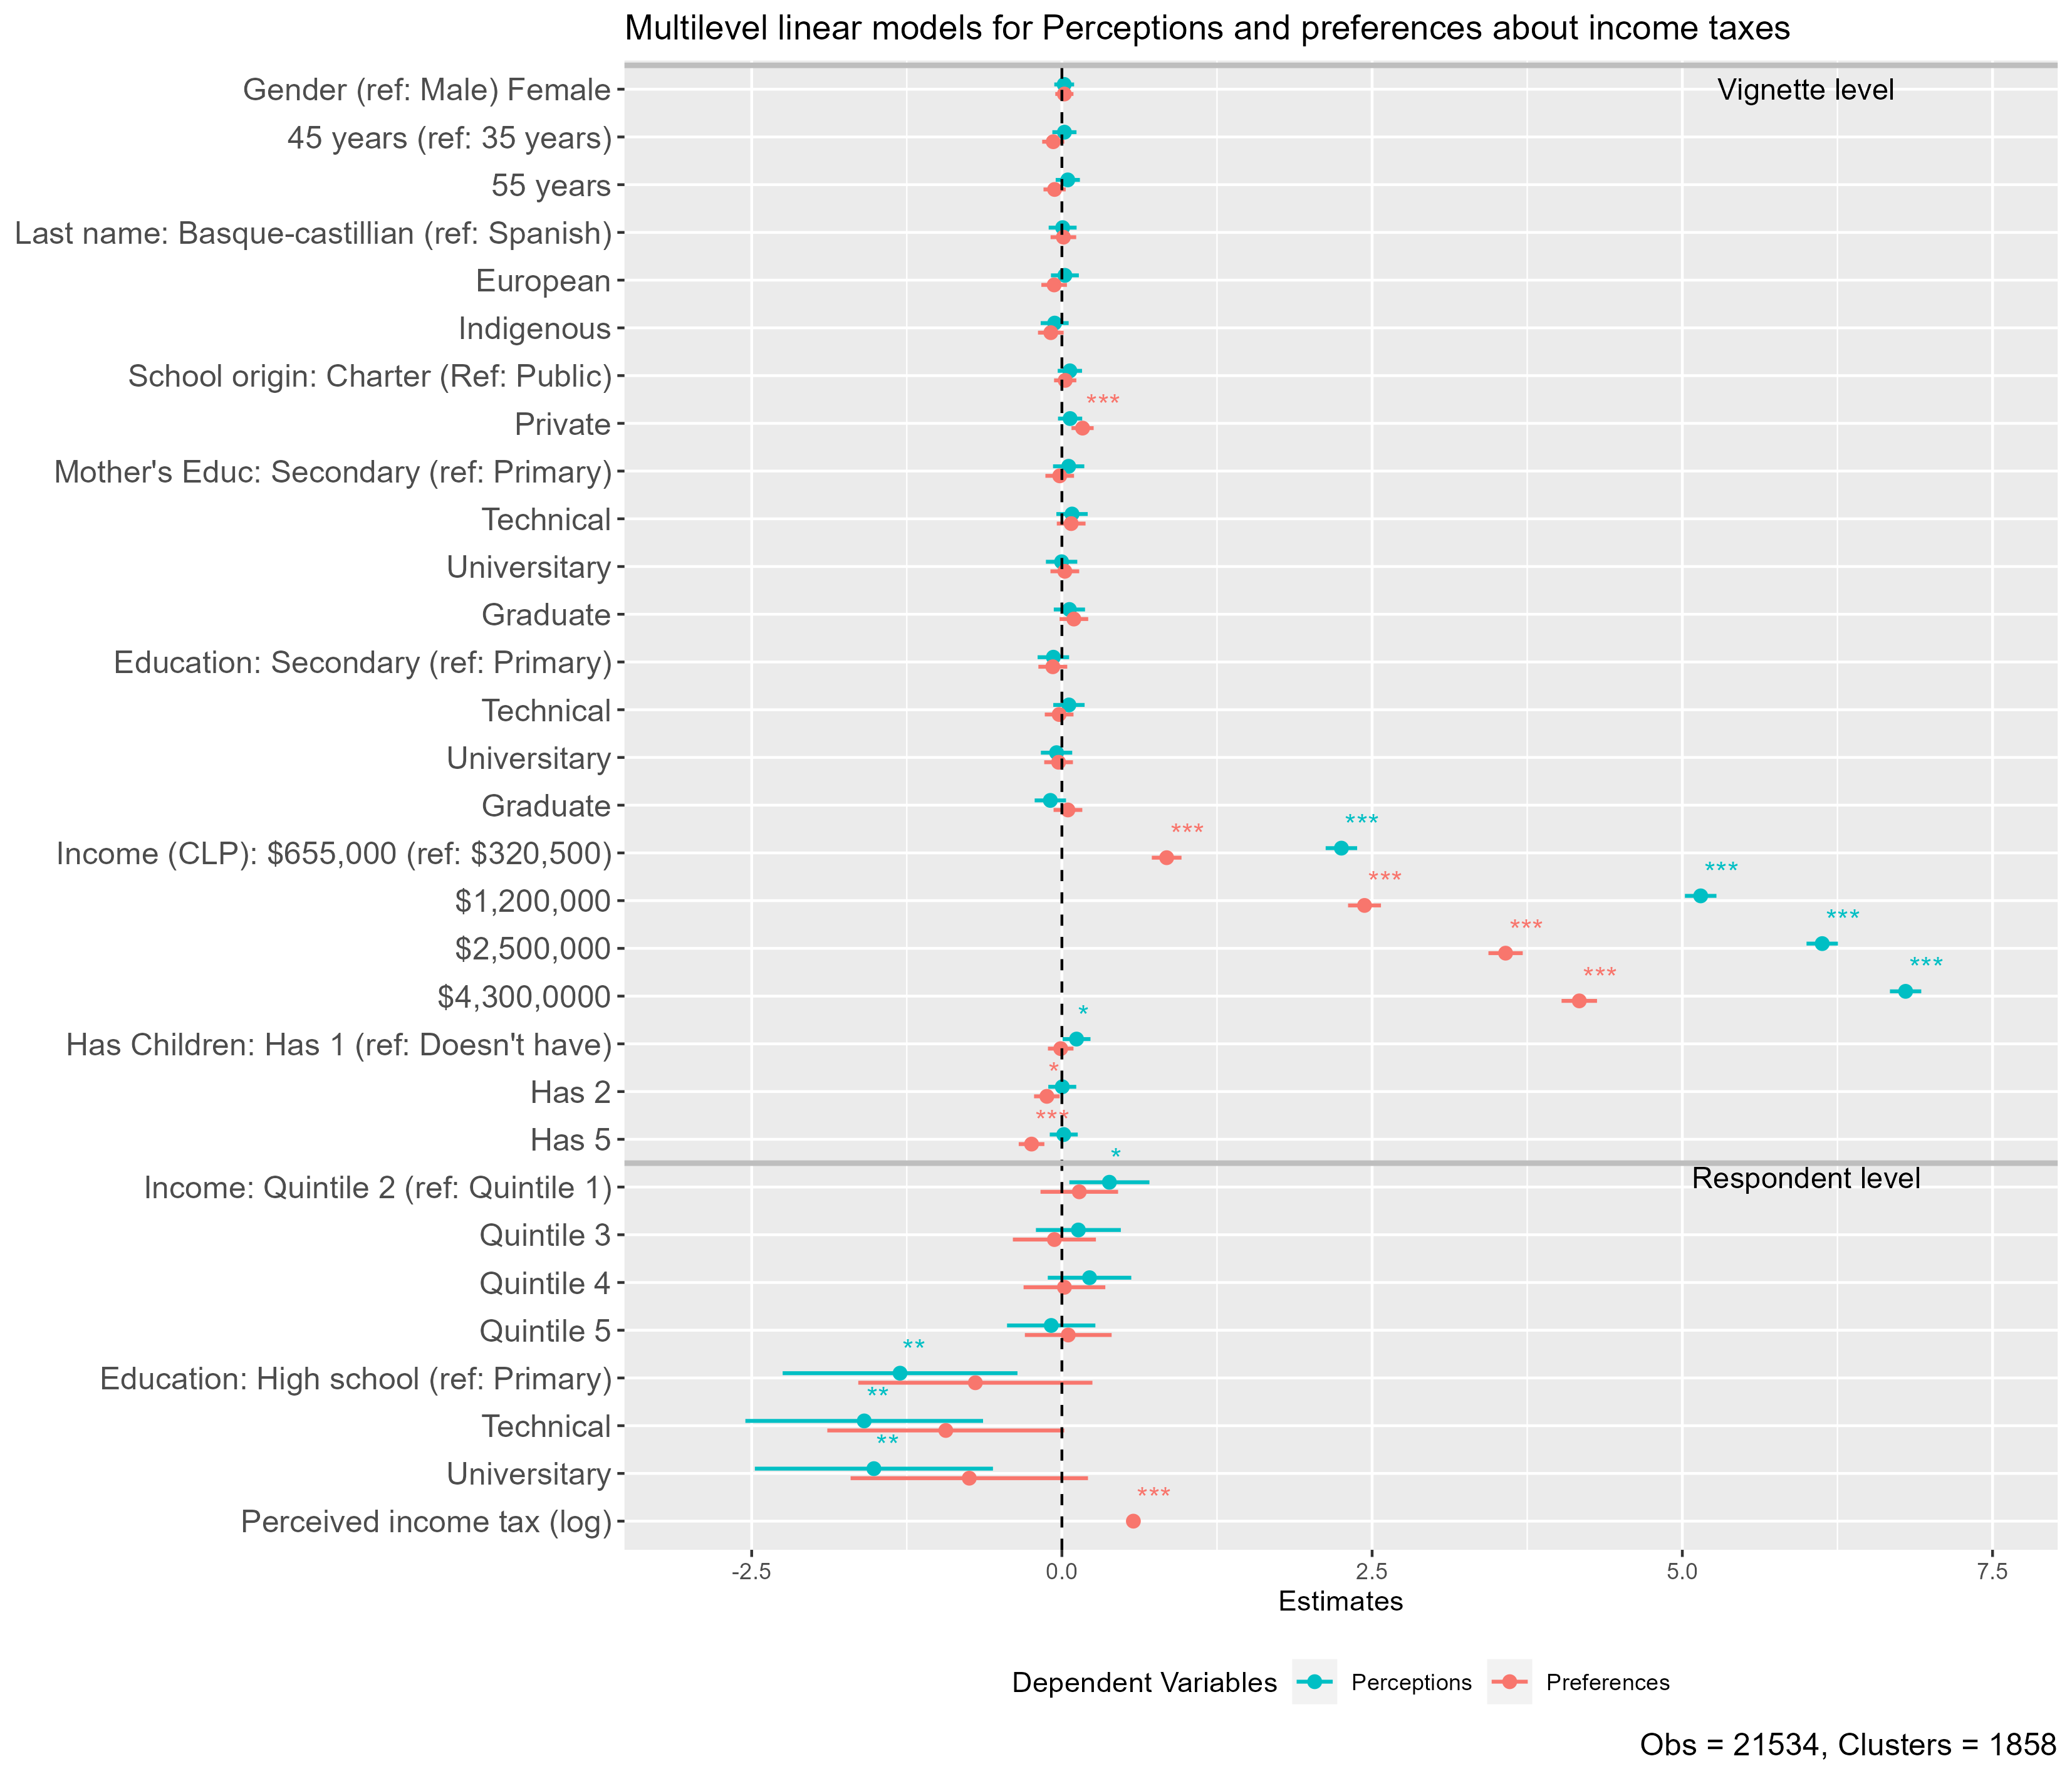
class: middle title-slide <style>.xe__progress-bar__container { top:0; opacity: 1; position:absolute; right:0; left: 0; } .xe__progress-bar { height: 0.25em; background-color: red; width: calc(var(--slide-current) / var(--slide-total) * 100%); } .remark-visible .xe__progress-bar { animation: xe__progress-bar__wipe 200ms forwards; animation-timing-function: cubic-bezier(.86,0,.07,1); } @keyframes xe__progress-bar__wipe { 0% { width: calc(var(--slide-previous) / var(--slide-total) * 100%); } 100% { width: calc(var(--slide-current) / var(--slide-total) * 100%); } }</style> .pull-left-narrow[ <br><br><br><br><br><br><br>   .small[.red[] ] ] .pull-right-wide[ .right[ .content-box-red[ ## Perceptions and preferences about income taxes: A factorial survey approach ] ---- .espaciosimplelineas[ .small[ Julio Iturra Sanhueza - BIGSSS<br> [jiturra@bigsss.uni-bremen.de](jiturra@bigsss.uni-bremen.de) <br><br> Juan Carlos Castillo - Universidad de Chile <br> Luis Maldonado - Pontificia Universidad Católica de Chile ] ] .small[ESRA Conference - 18th July 2023] ] ] --- class: inverse animated slideInRight ## .red[Perceptions and preferences about income taxes ] .pull-right[ .large[ 1. Introduction 2. Hypotheses 3. Methodology 4. Results 5. Discussion ] ] --- class: inverse ## .red[Perceptions and preferences about income taxes ] .pull-right[ .large[ 1. .yellow[Introduction] 2. Hypotheses 3. Methodology 4. Results 5. Discussion ] ] --- <br> .pull-left[ .content-box-gray[ ### Attitudes toward economic inequality - Subjective inequality (Janmaat, 2013) - Perception (_How is it_) - Preference (_How it should be_) - Perception anchors economic inequality justification (Wegener, 1987;Castillo, 2011) ] ] .pull-right[ .content-box-purple[ ### Public support for taxation - Self-interest and policy support (Meltzer & Richard, 1981; McCall & Kenworthy, 2009) - Deservingness opinions: merit and need (Van Oorschot, 2000;Sachweh & Eicher, 2023) ] ] --- class:inverse middle center ##.yellow[.small[_What is the role of self-interest and deservingness opinions on perceptions and preferences about income taxes?_]] --- class: inverse animated slideInRight ## .red[Perceptions and preferences about income taxes ] .pull-right[ .large[ 1. Introduction 2. .yellow[Hypotheses] 3. Methodology 4. Results 5. Discussion ] ] --- ## Hypotheses <br> .medium[ > H1: Higher status vignettes will obtain a larger preferred income tax. > H2: Respondents of lower status will perceive lower income tax. > H3: Respondents of higher status will prefer less income tax than those of lower status ] .small[ * Pre-registration: [https://osf.io/vpz86](https://osf.io/vpz86) ] --- class: inverse animated slideInRight ## .red[Perceptions and preferences about income taxes ] .pull-right[ .large[ 1. Introduction 2. Hypotheses 3. .yellow[Method] 4. Results 5. Discussion ] ] --- ## Data and methods ---- .pull-left[ .bold[Data:] * Online panel survey using quotas (Age, Gender, Education). * Chile - 2019 ( `\(N\)` = 1858) * _Method:_ Multilevel regression models ] -- .pull-right[ .bold[Vignette design:] - 8 dimensions - D-efficient solution ( `\(D\)` = 99.7) - sample of 120 vignettes - 10 Decks containing 12 vignettes each ] --- .pull-left[ <br> ### Dimensions <br><br><br><br><br><br><br><br><br><br><br><br><br><br> ]  --- ## Vignettes and outcomes -- .medium[ > Mr. Pailahueque is 55 years old, he studied in a municipal school and completed postgraduate studies. He has two children and his mother completed high school. He currently receives a gross monthly salary of $655,000 pesos.] -- .medium[ After the presentation of each description, two questions are asked: - How much do you think the person described **currently pays** in income tax? - How much do you think the person described **should pay** in income tax? The answers to these questions should be answered with amounts in Chilean pesos. ] -- .content-box-green[ .medium[**Note:** In Chile (2019) people with a earned income **below** $669,910 (monthly) are exempt from income taxes] ] --- ### Perceptions and preferences about taxes -- .pull-left[ - Responses with a value of $0 are present for both perceptions (~18%) and preferences (~30%) about income taxes - Perception: around 15% response accuracy (vig's `\(\le\)` $655,000) - For modelling zeros (add a constant value of `\(k_i\)` = 1): `$$I_{tax}= \ln\big(\text{income tax} + k_i\big)$$` ] -- .pull-right[ .center[] ] --- ## Independent variables ---- .pull-left[ .content-box-purple[ ### Vignettes (L1) * sociodemographic * SES and SES of origin * number of children ] ] <br> <br> <br> .pull-left[ .content-box-green[ ### Respondent (L2) * educational level * household income quintile * sociodemographic ] ] --- class: inverse animated slideInRight ## .red[Perceptions and preferences about income taxes ] .pull-right[ .large[ 1. Introduction 2. Hypotheses 3. Methodology 4. .yellow[Results] 5. Discussion ] ] --- .pull-left-narrow[ <br> ### Results ] .pull-right-wide[ .center[] ] --- class: inverse animated slideInRight ## .red[Perceptions and preferences about income taxes ] .pull-right[ .large[ 1. Introduction 2. Hypotheses 3. Methodology 4. Results 5. .yellow[Discussion] ] ] --- class: inverse .pull-left[ ### .red[Dicussion] - SES of *origin* (School as status marker) and *current* SES (income) of vignettes increases tax preferences (H1 ✓). - *Need* as the number of children decreases income tax preferences - *Respondent status:* R's Education matters only for higher perceived income taxes (~H2), but not for preferences (H3 ✖) ] .pull-right[ ### .red[Future research] - alternative models for accounting for $0 in DV - the role of perceptions and preferences about **meritocracy** - longitudinal analysis employing second wave ] --- class: roja middle center # Thank you! .right[ .yellow[More information: [jiturra@bigsss.uni-bremen.de](jiturra@bigsss.uni-bremen.de) [bit.ly/factorial-taxes](bit.ly/factorial-taxes) ]] --- class: middle title-slide .pull-left-narrow[ <br><br><br><br><br><br><br>   .small[.red[] ] ] .pull-right-wide[ .right[ .content-box-red[ ## Perceptions and preferences about income taxes: A factorial survey approach ] ---- .espaciosimplelineas[ .small[ Julio Iturra Sanhueza - BIGSSS<br> [jiturra@bigsss.uni-bremen.de](jiturra@bigsss.uni-bremen.de) <br><br> Juan Carlos Castillo - Universidad de Chile <br> Luis Maldonado - Pontificia Universidad Católica de Chile ] ] .small[ESRA Conference - 18th July 2023] ] ] <!-- --- --> <!-- perception and preferences for income tax --> <!-- -- meter transiciones en examples --> <!-- correccion hypotheses --> <!-- examples and outcomes --> <!-- editar website --> <!-- chequear carpetas esra-2023 --> <!-- bit.ly --> <!-- revisar titulos de plot de regresion --> <!-- Main results --> <!-- Future research --> <!-- - longitudinales --> <!-- - quantile -->